1. Introduction
On March 3, 2026, the city council of Birmingham, Alabama, approved a 180-day pause on new data center applications. The two projects already in permitting, the DC Blox expansion and the Nebius AI Factory, remained eligible to proceed under the rules in force when they applied (City of Birmingham 2026). Independence, Missouri, also paused new applications while allowing the Nebius project already under review to proceed under existing rules (City of Independence 2026). By August 2026, governments in 348 American counties had adopted 457 restrictions on data centers since January 2017, most of them in 2026.
In the usual account of local development politics, officials and the people who own and develop land want growth. They compete for projects that bring private investment and taxable property into their jurisdiction (Molotch 1976; Peterson 1981). The neighbors of a data center face its power demand, water use and noise, giving them reasons to oppose a project their officials want. When do local governments restrict data centers, and how do those restrictions relate to construction? To find out, we assembled an inventory of 2,165 data center projects from four public sources and matched it to the 457 restrictions across all 3,222 American counties and county equivalents.
We argue that a firm's ability to use the threat of building elsewhere depends on what the people deciding on its permit want. In the standard account, the threat gives the firm power because local officials want to retain the investment and the revenue it brings (Peterson 1981). Residents and council members seeking to keep a facility out have the opposite objective: the firm gives them what they want when it leaves. Officials seeking investment compete to retain it by offering tax incentives, a common part of negotiations over location (Jensen 2018).
A council faces different decisions as a project advances. Before permits are issued, officials decide what development to allow; later, they must also deal with the approvals already granted. Land purchases and contracts commit the developer to the site, and permits establish rights under the rules in force when they are issued. The Birmingham and Independence moratoria illustrate how councils handle applications at different stages: both pause new applications while allowing named projects already under review to proceed. Some commitments are made before the public hears about a project, through confidential site selection and negotiations over infrastructure and incentives (Wood and Phelps 2020; Kollar 2026a).
We expect counties to adopt restrictions soon after a project is announced, when the proposal attracts public attention and officials face decisions about its development (H1). Governments preparing for future investment also have reasons to adopt rules beyond the counties with recorded projects (H2). Restrictions should spread between counties where the same opposition group works, since those connections give officials and residents access to experience from other disputes (H3). We then compare construction outcomes for projects in counties that adopted early restrictions and for other projects announced in the same period. We use the 872 projects with a known county and an announcement date recorded to the month for this comparison.
Local restrictions emerge early in a project's public life and spread beyond places with recorded proposals. Counties were most likely to adopt their first restriction in the announcement month or the five months that followed, with an estimated increase in monthly adoption about five times the increases in later periods. Adoption was also more frequent after another county where the same opposition group was recorded had adopted, including counties that shared no border. More than half of adopting counties, 193 of 348, had no project listed in the assembled inventory. Restrictions were also associated with lower construction rates, with the largest difference where counties acted before any opposition action appeared in our sources. Projects in counties adopting restrictions within six months of announcement were nine percentage points less likely to have started construction by August 2026, after accounting for announcement month and capacity.
Local approval decisions give residents a means to challenge companies whose financial resources far exceed their own. Councils decide whether promised jobs and tax revenue justify the demands a facility places on electricity, water and nearby households. Residents seeking to keep a facility out achieve their objective when the developer leaves, changing the political value of a firm's threat to build elsewhere. Opposition groups working in several counties offer a route for sharing applications, hearing dates and experience from earlier disputes while developers still need permission to proceed. Who can use these opportunities matters for the distribution of development costs. Research on housing and wind energy shows how local participation favors privileged residents and how opposition is concentrated in wealthier or predominantly White communities (Einstein et al. 2019; Stokes et al. 2023).
2. Theory
2.1 Mobile capital, local refusal and timing
Research on business power ties corporate influence to low public attention (Culpepper 2010). Within technology firms, developers describe pressure to implement features that conflict with their own social values (Miklian and Hoelscher 2025). Data centers attracted public opposition in 2025 and 2026, and councils adopted hundreds of restrictions. What those decisions meant for a developer depended on which applications the rules covered, as the exemptions in Birmingham and Independence demonstrate. Much of the siting literature starts with a dispute over a named facility; the policy inventory also identifies governments regulating data centers in counties with no project in our records (Stokes et al. 2023; Reece et al. 2026). The decisions raise a further question about who bears the costs of development when one community refuses it and the developer seeks another site. Research on housing and wind siting connects local opposition to who participates in decisions and where projects are built (Einstein et al. 2019; Stokes et al. 2023).
In the city limits argument, capital and labor move across local borders, giving local governments a reason to pursue development because their tax base depends on it (Peterson 1981). The growth machine literature describes the coalition behind that pursuit: landowners, developers and allied officials who share an interest in more intensive land use (Molotch 1976; Logan and Molotch 2007). Landowners gain from higher property values and developers from new building, while the costs of development fall on a wider population. The competition for investment also gives firms access to public subsidies. State and local governments have paid incentives for location decisions that firms had already made (Jensen 2018; Slattery and Zidar 2020). Officials keep offering them partly because attracting a corporate headquarters affects how voters judge incumbents (Yang 2024).
The standard account assumes that the people deciding on a project want the investment. We use refusal to mean their choice to withhold permission from a proposed facility. Who controls that choice varies across places: officials weigh general welfare against benefits concentrated among influential constituencies, and dependence on an established industry shapes both government capacity and the firm's bargaining position (Bhaumik et al. 2024; Elder 2025). A council that refuses permission denies the developer use of that site. Securing a data center location requires coordination with local government over planning and infrastructure, as the Luleå and Stockholm cases demonstrate (Ramos Cáceres et al. 2024).
Residents who organize against a facility want different things. Some want it kept out, some want time to examine the proposal, and others want better terms. A pause answers a demand for time; abandoning the development answers a demand for exclusion. Social movement research compares outcomes with participants' demands and considers what agreeing to those demands would cost the target (Amenta et al. 2005; Luders 2010). Table 1 distinguishes these outcomes and specifies the records needed to establish each one.
Once a multinational has invested, its assets are tied to the location, shifting bargaining power toward the host government (Vernon 1971). A council deciding whether to admit a new facility faces an earlier stage of that relationship. Spending tied to a site begins with options on land and agreements over infrastructure, giving developers reasons to defend the location before construction starts; officials who supported the project also have reasons to protect those decisions. Google's proposed data center in Luxembourg stayed suspended for years while the firm retained its options and the unfinished development became an issue in local politics (Carr and Madron 2025). Much of the preparation occurs out of public view through confidential negotiations and site-selection intermediaries, and disputes over disclosure also surround incentive renegotiations (Wood and Phelps 2020; Jensen and Thrall 2021). In Oregon, fiscal incentives, utility arrangements and land-use decisions were negotiated as parts of the same development process, extending beyond the planning hearing (Kollar 2026a).
Residents learn about a proposal at some point in this process, often after negotiations have begun. A council hearing objections before it grants permits is deciding whether to approve development; a council hearing them afterwards must also address the approvals it has issued. Public attention changes the conditions under which business exercises influence, and firms' own conduct can disrupt the political relationships on which that influence rests (Culpepper 2010; Bell and Hindmoor 2024). A firm's response to social demands also depends on whether those demands enter company decisions through binding rules or through political pressure (Miklian 2026b). Siting research examines who opposes a named project and whether their opposition changes its prospects (Giordono et al. 2018; Dokshin 2016; Stokes et al. 2023). We examine when local governments adopt their first restriction, using the public announcement as the dated event around which to compare their decisions. The development histories in Luxembourg and Oregon place that announcement within a longer process of spending, negotiation and approval. H1 (timing): a county's monthly rate of first restriction is higher in the six months beginning with a data center announcement than in later months, before announcement, or in counties with no recorded project.
2.2 Preparation and the spread of restrictions
Local governments also prepare rules for development they expect in the future. Staff must understand the industry and draft an ordinance before a council can vote on a pause. Research on data centers shows local leaders preparing land and institutions years before anticipated investment arrives; the same administrative capacity is available to officials who want to restrict development (Burrell 2020). County wind ordinances evolved through experience with regulation, and research on solar development likewise examines where local ordinances govern construction (Winikoff 2022; Lee et al. 2026). Studies of data center opposition have followed disputes over named facilities (Kollar 2026a; Reece et al. 2026). Preparing for future proposals gives officials elsewhere a reason to act as well, extending regulation beyond the sites listed in a project inventory. H2 (geography): most counties that adopt a data center restriction have no project recorded in the assembled inventory.
Borrowing from other governments reduces the work of preparing a local policy. Officials can use another council's account of the problem and the ordinance it adopted, then decide how those rules fit their own jurisdiction (Berry and Berry 1990; Boushey 2010). Governments learn about a policy's political acceptability as well as its performance, and a shared understanding of an issue spreads before agreement on a particular response (Gilardi 2010; Gilardi et al. 2021). For a council preparing data center rules, another jurisdiction's moratorium supplies an example of how to pause applications during that work. Research on state policy uses the order of adoption to estimate which connections link governments adopting the same policy (Desmarais et al. 2015; Harden et al. 2023).
Opposition groups provide one route for officials and residents to learn about restrictions elsewhere. In municipal fracking politics, coalition partners and a group's position among other organizations shaped who proposed policy (Arnold et al. 2017). Local restrictions on renewable energy cluster near earlier adopters, while policies also spread between states governed by the same party (Ko et al. 2023; DellaVigna and Kim 2026). A group working in two counties offers a connection through which residents and officials can exchange an ordinance or contact someone involved in the earlier dispute. Our test identifies these connections from records naming the same group in both counties. We count the connection from the following month and compare counties in the same state and month, so the recorded presence of the group comes before the adoption being examined. H3 (organizational ties): after a county adopts a restriction, other counties where the same opposition group has been recorded have a higher rate of first restriction during the next three months, including counties that share no border with the adopter.
2.3 What a pause governs
We expect fewer construction starts where councils adopt restrictions to stop proposed facilities, with the largest difference where residents organized against development before the vote. The applications already filed also affect what a council achieves through a pause. A project under review remains eligible to proceed when the ordinance exempts that application. We therefore compare construction across counties with and without opposition recorded before adoption, while examining the application rules in the two municipal examples. Birmingham's pause covers new applications for facilities of 20 megawatts or more and allows the DC Blox expansion and Nebius AI Factory, both already in permitting, to proceed under existing rules (City of Birmingham 2026).
The sequence from announcement to restriction involves several possible routes to a council vote. Residents press officials to act, officials prepare rules themselves, and financial or infrastructure problems affect projects while those decisions are under way. Reporting also brings projects, groups and policy decisions into the record together. We examine these sequences by dividing projects according to whether an opposition action was recorded in the county before its first restriction and by comparing restriction dates with cancellation dates. These comparisons establish which event was recorded first and identify cases for examining how officials reached their decision. Work on political mediation examines how movements change specific decisions, including whether officials respond to their demands (Amenta et al. 2005; King 2008).
State governments can take the decision away from a council. State preemption, through which state law limits local authority, has expanded in response to local policy initiatives, and planning research identifies the same conflict over data center regulation (Riverstone-Newell 2017; Goodman et al. 2021; Goodman and Hatch 2024; Kollar 2026b). Within a jurisdiction, homeowners with time to attend hearings and a property interest in the outcome have disproportionate influence over land-use decisions (Einstein et al. 2019; Hankinson 2018; Marble and Nall 2021). A refusal also affects people beyond the jurisdiction when a developer seeks another site. Following the firm's subsequent proposals would show where that search leads and who faces the next development, extending the questions about unequal siting burdens examined in research on wind and polluting facilities (Stokes et al. 2023; Mohai and Saha 2015).
Table 1. Outcomes and the records needed to establish them
| Outcome | What happens | Records needed |
|---|---|---|
| Regulatory adoption | A local government adopts a restriction | A dated ordinance or other policy instrument |
| Binding project coverage | The restriction applies to a particular project | Authority, project location, regulated use, effective dates, exemptions and application history |
| Delay | A project takes longer to reach a development milestone | Dated milestones and a comparison of development timelines |
| Permanent prevention | The proposed development is abandoned | Project history confirmed through extended follow-up |
| Conditional approval | A project is approved under changed terms | Documents specifying the revised terms or obligations |
3. Data and Methods
3.1 Project and policy inventories
We match projects and restrictions by county. The project sources locate facilities by address and the policy sources identify the jurisdiction adopting an ordinance; both can be assigned to a county. The panel covers all 3,222 counties and county equivalents in the 50 states, the District of Columbia and Puerto Rico during the 116 months from January 2017 to August 2026. We assembled the project inventory from Server Country, Compute Atlas, EPA air-permit and facility records, and Epoch AI. We then grouped entries referring to the same development into a single project record, which we call a cluster. The inventory contains 2,165 clusters, of which 2,130 are assigned to 692 counties; 35 have no resolved county assignment. A cluster can include several phases of one campus. Where an operator or project name changed across sources, the release preserves the identifiers and source dates so readers can check how we linked the entries and classified continuation or cancellation (SI S2).
Restrictions come from the Moratorium Nation inventory, which covers several industries (Bommarito 2026). Of its 533 rows, two are aggregate entries and 531 map to a place. Among the place-based records, 490 have a usable month within our study period, and 466 of those explicitly identify data centers as a regulated sector. Removing nine records marked pending leaves the 457 restrictions in 348 counties used in the main analysis; we restore those nine in a second series of 466 records to check how they affect the results (SI Table S1). Each restriction enters the series at adoption and remains there even if it later expired, was replaced or was rescinded. The inventory's authors searched state by state from May through July 2026 and continued collecting records through August 19, 2026. Earlier restrictions entered as they came to the authors' attention, so we compare counties within the same calendar month to account for changes over time in both adoption and collection (SI S11).
To test H2, we classified the 348 adopting counties by their project histories at the month of first restriction. We used the entire project inventory, including cancelled developments, because a cancelled proposal still records a developer's interest in the county. A county enters the prior-project group when at least one project was announced in or before the adoption month or was dated to an earlier year. Where prior presence remains unresolved, a project dated only to the adoption year or lacking a date places the county in the unresolved group. The later-project group contains counties whose recorded projects all follow adoption, and the final group contains counties with no project in the inventory. Table 2 reports these four groups; SI S2 gives the classification rules and the results after restoring pending restrictions.
3.2 Adoption panels and the construction comparison
The timing test compares a county's monthly rate of first restriction before and after its first recorded project announcement. A county enters the announcement group when its earliest announcement is dated to a month between February 2017 and August 2026 and every other recorded project is dated at or after that month. This rule identifies 271 counties; the 2,530 counties with no project in the inventory form the comparison group (SI Table S2). We then remove counties with an undated restriction because we cannot assign their first adoption to a month, leaving 262 announcement counties and 2,516 comparison counties. Each contributes one observation per month until its first restriction or August 2026. The outcome equals one in the month of first adoption and zero in earlier months, yielding 247 first adoptions in 321,054 county-months (Table 3).
We first estimate how the monthly adoption rate differs after a project announcement, comparing counties within the same calendar month and clustering standard errors by county. The outcome is whether the county adopts its first restriction that month, and the coefficient expresses the difference in percentage points. A second regression divides the period after announcement into months zero to five, six to eleven, and twelve onward; Figure 1 plots the three estimates, and we calculate the differences between the first period and each later period from that same regression. Counties leave the sample after their first restriction, following event-history practice for studying first adoptions (Berry and Berry 1990). SI Table S4 repeats the comparison with state-by-month effects, county effects, state-clustered errors, pending restrictions restored, and August observations removed. To examine events before announcement, we count first restrictions by the number of months they precede it (SI Table S16). We also date the earliest local reporting on data center contention within each county, assigning outlets to counties through the 3DLNews directory (Ariyarathne and Nwala 2024).
The test of adoption among counties connected by opposition groups uses a larger sample: all 3,184 counties whose recorded restrictions have dates. It contains 367,746 county-months and 332 first adoptions, with each county again leaving the sample after its first restriction. We identify groups through the Data Center Opposition Tracker, a public dataset of local campaigns that records the organizations named in each dispute and the dates of the sources naming them.
We connect two counties from the month after the same group has been recorded in both. For each county-month, we count how many connected counties adopted their first restriction during the previous three months, separating neighboring counties from those that share no border. Separate regressions for these two connections compare counties within the same state and month and account for the county's own announcement status, unresolved project dates and the number of neighboring counties that adopted earlier. Comparing counties within the same state and month accounts for circumstances they share, such as a statewide policy debate. The model for counties that share no border also includes a connection based on assignment to the same news outlet's website in the outlet directory (SI S6; Table S9).
For construction, we compare projects in counties that adopted a restriction within six months of announcement with other projects whose announcement month is known. The sample contains 872 projects with a county assignment and an announcement month: 386 were recorded as started by August 2026, 395 as announced and 91 as cancelled. We call a project exposed when its county adopted a restriction during the announcement month or the five months after it; 94 projects meet this definition, including 70 announced in 2026. We regress recorded construction status on this county exposure, announcement-month effects, the logarithm of one plus reported megawatts, and an indicator for missing capacity. The model compares projects announced in the same month and accounts for differences in reported size; standard errors come from 999 county-level bootstrap draws (Table 4).
A second regression divides the exposed projects according to whether an opposition action was recorded in the county before its first restriction, using the Data Center Opposition Tracker, movement records, the Crowd Counting Consortium and ACLED, and directly estimates the difference between those two groups. SI Tables S6 to S8 report alternative three-, nine- and twelve-month exposure windows, shifted policy dates, equal follow-up, bounds on twelve-month construction shares, and monthly models of starts and cancellations. The exposure measure pairs each project with restrictions adopted somewhere in its county; SI S8 lists the resulting 149 pairings of 94 projects with 115 distinct instruments.
4. Findings
4.1 Geography of restrictions
Most counties that adopted a restriction have no project listed in our inventory. Of the 348 adopting counties, 193 fall in this group, while 121 had a project announced in or before the month of their first restriction. Another 28 have projects whose dates leave the order unresolved, and six have projects first recorded after adoption. The prior-project group includes proposals later cancelled, because those proposals establish that developers had considered a location in the county before it acted (Table 2).
Counties with a recorded project adopted restrictions at nearly three times the rate of counties with no recorded project: 155 of 692, or 22 percent, compared with 193 of 2,530, or eight percent. The latter still form the majority of adopters because there are more than three times as many counties in that group. The 155 counties with projects consist of the 121 with a prior project, the 28 with unresolved timing and the six with a project first recorded after adoption. Restoring the nine pending restrictions adds seven adopting counties; the count with no recorded project becomes 195 of 355 (SI Table S3).
The restrictions are concentrated in 2026. Of the 457 in the main series, 388 carry a 2026 adoption date, 58 a 2025 date and 11 an earlier date. The inventory's systematic state-by-state search ran from May to July 2026, making 2026 both the year with the most recorded adoptions and the period of the fullest search. At the August snapshot, the inventory classified 364 restrictions as active, 39 as extended, 30 as replaced, 19 as expired and five as rescinded (SI S11).
Table 2. Project history at first recorded policy adoption
| Project history | Counties | Percent |
|---|---|---|
| No project recorded in inventory | 193 | 55.5 |
| Known project at or before adoption | 121 | 34.8 |
| Project timing unresolved | 28 | 8.0 |
| Projects recorded only after adoption | 6 | 1.7 |
| Total | 348 | 100.0 |
Note: Main series of dated restrictions explicitly covering data centers, adopted from January 2017 to August 2026.
4.2 Timing of first restrictions after announcement
Counties most often adopted their first restriction in the announcement month or the five months after it. Among the 262 announcement counties, 30 first restrictions fell in that period, six in the next six months and seven in months twelve to twenty-four (SI Table S16). First adoption is rare across the full panel. There were 247 such decisions across 321,054 county-months, about one adoption for every 1,300 monthly observations (Table 3).
Comparing counties within the same calendar month, the estimated increase in monthly adoption after announcement is 0.84 percentage points, with a 95 percent interval of 0.48 to 1.20 (Table 3, column 1). The alternative specifications in SI Table S4 change the estimate by at most 0.2 points. Most of the increase occurs in the first six months: 1.75 points in months zero to five, compared with 0.30 in months six to eleven and 0.38 from month twelve onward (Figure 1). Calculating the differences between those periods directly confirms that the first period exceeds each later one. Both 95 percent intervals for those differences are above zero (SI Table S17).
Table 3. Regressions of first recorded policy adoption
| Dependent variable: first adoption | (1) Month | (2) State-month | (3) County + month | (4) Timing bins |
|---|---|---|---|---|
| Post announcement | 0.84 (0.18) | 0.82 (0.18) | 1.03 (0.22) | |
| Months 0-5 | 1.75 (0.39) | |||
| Months 6-11 | 0.30 (0.28) | |||
| Month 12 onward | 0.38 (0.21) | |||
| Calendar-month effects | Yes | No | Yes | Yes |
| State-by-month effects | No | Yes | No | No |
| County effects | No | No | Yes | No |
| County-months | 321,054 | 321,054 | 321,054 | 321,054 |
| County clusters | 2,778 | 2,778 | 2,778 | 2,778 |
| First adoptions | 247 | 247 | 247 | 247 |
Note: OLS coefficients in percentage points per county-month; county-clustered standard errors in parentheses. Each column is a separate regression. Column 4 includes the three timing indicators together, comparing those periods with pre-announcement observations and counties with no recorded project. Observation ends at first adoption. The sample contains 262 announcement counties and 2,516 comparison counties. Absorbed effects include the intercept. SI S3 and S11 report 95% intervals, alternative inference and direct comparisons between periods.
Figure 1. Timing of recorded policy adoption
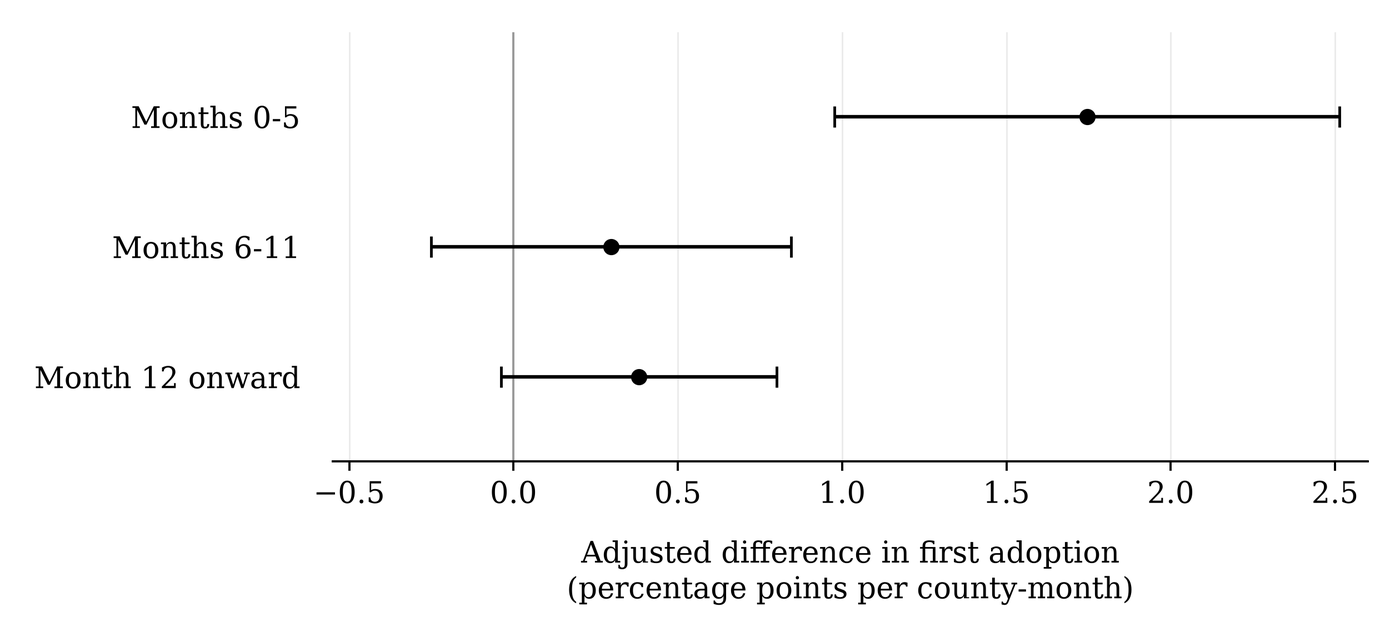
Note: Points and 95% county-clustered normal intervals from Table 3, column 4, in percentage points per county-month. The comparison includes pre-announcement observations and counties with no recorded project. The model contains 321,054 county-months, 2,778 counties and 247 first adoptions.
Local reporting on data center contention sometimes precedes the first recorded project announcement. Of the 262 announcement counties, 225 have an outlet website assigned to that county alone in the 3DLNews directory. In 39 of these counties, we found contention reporting during the twenty-four months before announcement; the median lead was ten months (SI S10). Articles enter this count through the outlet's county assignment in the directory. Six counties also adopted their first restriction before the announcement month, four of them in the preceding two months (SI Table S16).
4.3 Adoption among counties sharing opposition groups
Counties where the same opposition group is recorded also adopt restrictions in succession. Across the larger panel used for this comparison, there is about one first adoption for every 1,100 county-months. The rate is much higher during the three months after a connected county adopts. Five of 48 county-months following adoption by a neighboring county with a shared group ended in a first restriction. For connected counties that shared no border, twelve of 169 county-months ended in adoption (SI Table S10). The two sets overlap by 26 county-months and three adoptions, yielding fourteen distinct adoptions across 191 county-months.
The regression estimates how monthly adoption differs with each additional connected county that adopted during the previous three months. For a neighboring county with a shared group, the estimate is 6.61 percentage points, with a 95 percent interval of -1.10 to 14.32. For a connected county that shares no border, it is 1.34 points, with an interval of -0.23 to 2.91. These comparisons account for state and month, the county's own project status and earlier adoptions by its neighbors, using the controls in Section 3.2 (SI Table S9). Twelve of the fourteen distinct adoption events occurred where the organizational connection crossed a gap between counties, including three events also connected to a neighboring adopter (SI Table S10).
The news-outlet measure connects counties assigned to the same website in the 3DLNews directory. Among counties sharing a website with a recent adopter that shared no border, four of 203 county-months ended in adoption. The corresponding count for the two organizational connections combined is fourteen adoptions across 191 county-months. Accounting for the other variables in the regression gives an estimated difference of 0.36 percentage points for the shared-website connection, with a 95 percent interval of -1.29 to 2.01 (SI Tables S9 and S10).
4.4 Construction status and early county restrictions
Fewer projects had started construction in counties that adopted a restriction within six months of announcement. By August 2026, fifteen of the 94 projects in this group had a recorded start, compared with 371 of the other 778 projects, or sixteen percent against 48 percent. The two groups differ in how long they had to begin construction: 70 of the 94 exposed projects were announced in 2026, giving them at most eight months of follow-up. After accounting for announcement month and reported capacity, projects in counties with early restrictions were 9.46 percentage points less likely to have started (95 percent interval for the difference: -18.39 to 0.06; Table 4, column 1). The difference remains negative with alternative exposure windows, shifted policy dates and equal follow-up (SI Table S6).
The 94 exposed projects divide into 58 in counties with an opposition action recorded before their first restriction and 36 in counties with no prior action recorded in the four sources. Fourteen of the 58 projects in the first group had started construction, compared with one of the 36 in the second (SI S10). After accounting for announcement month and capacity, projects in counties with a prior recorded action were 2.43 percentage points less likely to have started than the other 778 projects. For projects in counties with no prior recorded action, the difference was 20.97 points. The estimated difference between the two exposed groups is 18.53 points, with a 95 percent interval of 4.80 to 32.40 (Table 4, column 2).
Table 4. Regressions of recorded construction status
| Dependent variable: construction started | (1) Pooled exposure | (2) Prior-opposition split |
|---|---|---|
| Early county restriction | -9.46 (4.78) | |
| Early restriction, prior action recorded | -2.43 (6.26) | |
| Early restriction, no prior action recorded | -20.97 (4.78) | |
| Log(1 + reported MW) | -0.37 (1.22) | -0.28 (1.22) |
| Capacity missing | -15.12 (7.25) | -14.28 (7.26) |
| Announcement-month effects | Yes | Yes |
| Projects | 872 | 872 |
| County clusters | 495 | 495 |
| Recorded construction starts | 386 | 386 |
| Exposed projects | 94 | 58 / 36 |
Note: OLS coefficients in percentage points; county-bootstrap standard errors in parentheses (999 valid draws; seed 20260906). An exposed project is in a county that adopted a restriction during its announcement month or the following five months. Both columns include the displayed capacity terms and absorbed announcement-month effects, including the intercept. Missing capacity is set to zero with its indicator. Column 2 compares both exposed groups with the same 778 other projects. The difference between those groups is 18.53 points, with a 95% percentile interval of [4.80, 32.40]. The pooled 95% interval is [-18.39, 0.06]. SI S4 and S10 report sensitivity and chronology checks.
Twenty-one of the 94 exposed projects were classified as cancelled by August 2026, eleven in counties with prior recorded opposition and ten in the other group. Comparing each assigned cancellation month with the first restriction in that project's six-month exposure window, the restriction came first in eight cases, both fell in the same month in six, and cancellation came first in seven. Seven of the cancellation dates come from the report documenting the cancellation, which places the event at or before that report's month. SI Table S8 reports monthly models of starts and cancellations using the dated events. SI Table S7 gives bounds on twelve-month construction shares for the 430 projects with a full year of follow-up through July 2026; seven are exposed, and 153 construction starts in the comparison group have no recorded month.
5. Discussion
A firm's threat to build elsewhere puts pressure on officials who want its investment; officials seeking to keep a facility out achieve their objective when it leaves. Local restrictions also differ in which projects they cover. Birmingham paused new applications for facilities of 20 megawatts or more filed after March 3, 2026, while preserving the rules for two projects already in permitting. Independence's pause covers new data center and battery storage applications and exempts the Nebius project already under review (City of Birmingham 2026; City of Independence 2026). These councils retained the ability to review rules for future applications while allowing the named projects to continue through the existing process. In the national construction comparison, the largest difference is among the 36 projects in counties where the restriction preceded any opposition action recorded in our sources, with one project recorded as started by August 2026. State legislatures also decide how much authority councils retain over such development. The state-policy file contains 438 data center bills, of which 399 have a last action in 2025 or 2026, placing the local decisions within the wider conflict over state and municipal authority (Goodman et al. 2021; SoRelle and Fullerton 2024; Kollar 2026b).
Beginning with a disputed facility determines which local decisions enter a study of siting politics. Research has used those disputes to examine who opposed development and what happened to the proposal (Giordono et al. 2018; Stokes et al. 2023; Reece et al. 2026). Our project inventory covers 155 of the 348 adopting counties; the policy records identify another 193 with no recorded project. Studying decisions in those counties requires starting with the local government, using policy documents and meeting records such as those collected by LocalView (Barari and Simko 2023). The same records offer a way to trace what officials learned through organizations working across counties, including how an earlier dispute shaped their understanding of the problem and their choice of response (Gilardi 2010; Gilardi et al. 2021). Our organizational dates establish when a group had been recorded in both counties, while meeting accounts and interviews provide the detail of what participants exchanged. Local reporting supplies another dated account of contention, including the coverage preceding project announcements in 39 counties, and connects public decisions to the electoral accountability studied in research on the local press (Snyder and Strömberg 2010; SI S10).
Who benefits from a refusal depends on who participates in the decision and where the developer seeks to build next. Homeowners with time to attend hearings and file comments are overrepresented in land-use decisions and use those procedures to oppose nearby development (Einstein et al. 2019). Tracking an operator's later proposals would identify the communities approached after a refusal and the people asked to bear the demands on electricity and water that the first community sought to avoid. The present inventory records the proposed location and source-reported status of each project, including 91 classified as cancelled; subsequent applications provide the records needed to follow those firms beyond the cancelled sites (SI S2).
5.1 Limitations
Announcements, opposition and restrictions respond to the same development pressures, and problems with financing or grid connections affect a project's prospects before a council acts. The comparisons measure associations within those sequences. Seven exposed projects have cancellation dates before the relevant restriction and six have cancellation and restriction in the same month. Month-level dates leave the order of a hearing, application and vote within a month unresolved, while developers choose when to announce publicly and sometimes do so after residents and officials have learned of the proposal. Construction dates are also incomplete: of fifteen exposed projects recorded as started, twelve have no resolved start month, two began before the relevant restriction and one began after it. Seventy of the 94 exposed projects were announced in 2026, leaving a short period in which to observe construction by August. The pooled construction estimate has a 95 percent interval from -18.39 to 0.06 percentage points. Longer follow-up is needed to distinguish projects that eventually proceed from those abandoned or moved; the twelve-month comparison currently contains seven exposed projects among 430 with a full year of observation (SI Tables S6 and S7).
Documentation is uneven across places and years: the policy inventory's systematic search ran from May to July 2026, and its authors flagged 147 of the 457 eligible records for source verification. Language-model coders checked source excerpts for a sample of 100 tracker records and found full support for the named group in seven and partial support in ten (SI Table S13). AI answer engines studying armed conflicts with sparse reporting made more factual errors than they did on extensively covered conflicts (Miklian 2026a). A group's date marks its first appearance in the sources for a county; establishing when the group began its work requires a separate history of the campaign. Groups' choices about where to work also shape these connections, since an organization has reasons to concentrate its efforts in receptive counties. The adjacent and nonadjacent estimates rest on five and twelve adoption events, respectively, and both county-clustered intervals include zero. Establishing what the second council learned from the first requires the documents or interviews recording that exchange. The four opposition sources differ in collection procedures and geographic coverage, making the split in Table 4 depend on which actions they captured before adoption, as research on protest data illustrates (Dorff et al. 2023; Fisher et al. 2019; Wang et al. 2016).
The construction measure matches projects and restrictions within a county, whereas legal coverage depends on the authority adopting the rule, the land it governs, the regulated use, operative dates and application history. The review file contains 149 pairings of 94 projects with 115 distinct instruments; the pairings involve 63 city, 31 county, 31 township, thirteen town, nine village and two other entries (SI S8). A city ordinance applies within the city's territory, leaving projects elsewhere in the county under their own jurisdiction's rules. Checking the dates also establishes whether a restriction had expired or been replaced before the project decision. Independence expressly exempts the Nebius project already under review, yet the project meets our county exposure definition. Removing that project changes the estimated construction difference to -10.48 percentage points, with a 95 percent interval of -19.73 to -0.72 (SI Table S6). The institutional argument rests on American land-use arrangements, in which counties and municipalities exercise local authority and residents contest applications through hearings. Authority is allocated differently where a national agency selects sites, and it also varies within our sample of 52 state-level jurisdictions.
6. Conclusion
Between January 2017 and August 2026, local governments in 348 American counties adopted 457 restrictions on data centers. Most adopting counties have no project listed in our inventory; among counties with dated announcements, first restrictions cluster in the announcement month and the five months that follow. Adoption is also more frequent after a county where the same opposition group is recorded adopts, including when the two counties share no border. Projects in counties adopting early restrictions were less likely to have started construction by August 2026, after accounting for announcement month and capacity, and the largest difference was among projects in counties with no opposition action recorded before the restriction. We argue that the value of a firm's threat to build elsewhere depends on what local decision-makers want: officials seeking investment compete to retain it, while officials seeking exclusion achieve their objective when the developer leaves. A council adopting a pause must also decide what happens to applications already filed. In Birmingham and Independence, councils halted new applications while allowing specified projects already under review to proceed under existing rules (City of Birmingham 2026; City of Independence 2026).